Create your map!

In the Atlas section, dedicated to maps, you will find cartographic content and outputs from our research. In addition to interactive maps, you can also create your own map by uploading data from our archive.

Create your map

string(18) "bibliografia_array"

array(0) { }

stringa:


string(15) "argomento_array"

array(0) { }

stringa:


string(10) "anno_array"

array(0) { }

stringa:


string(24) "regione_geografica_array"

array(0) { }

stringa:


string(12) "source_array"

array(0) { }

stringa:


string(13) "keyword_array"

array(0) { }

stringa:


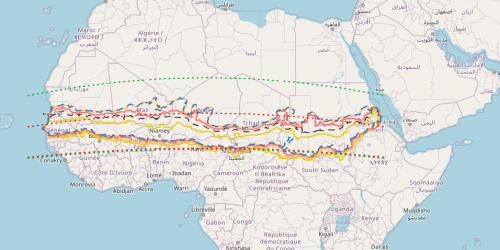
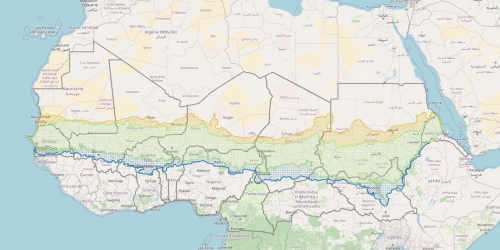
1- Borders of the Sahel according to various authors
To define the borders of the Sahel, Sivakumar and Wallace (1991) suggest the latitudes 10–15° N, while Nicholson and Palao (1993) propose the latitudes 10–20° N. Davy et al. (1976) identify the "morphological Sahel" between the isohyets of 100 mm and 700 mm/year. Agnew (1982) chooses the isohyets of 200 mm/year for the northern limit and 700 mm/year for the southern limit. Giri (1983) identifies the Sahel between the isohyets of 150 mm/year in the North and 650 mm/year in the South. Hulme (1992) uses the isohyets of 100–600 mm/year. The thresholds identified by the authors were maintained, but the isohyets was recalculated on the same series of data that we used in our proposal (i.e., the Climate Hazards Group InfraRed Precipitation with Station [CHIRPS] data, 1981–2023).
string(18) "bibliografia_array"

array(0) { }

stringa:


string(15) "argomento_array"

array(0) { }

stringa:


string(10) "anno_array"

array(0) { }

stringa:


string(24) "regione_geografica_array"

array(0) { }

stringa:


string(12) "source_array"

array(0) { }

stringa:


string(13) "keyword_array"

array(0) { }

stringa:


2- Sahel on the move
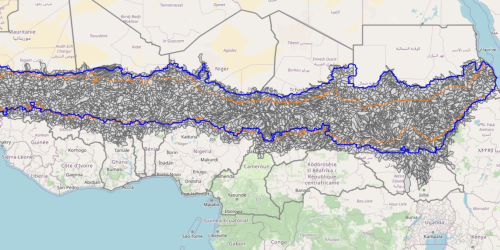
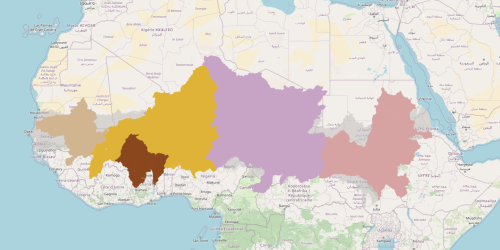
We identify the pluviometric Sahel by setting the northern limit at the isohyet of 150 mm/year from the wettest five-year period and the southern limit at the isohyet of 850 mm/year from the driest five-year period. In this way, starting from Giri's (1983) extended definition (the actual Sahel and the transitional zone towards the Sudanese climate), we have identified the maximum extension reached, under different rainfall conditions, by the Sahel in the period considered. This is the maximum expansion of the Sahelian region in the alternation of wet and dry conditions.
string(18) "bibliografia_array"

array(0) { }

stringa:


string(15) "argomento_array"

array(0) { }

stringa:


string(10) "anno_array"

array(0) { }

stringa:


string(24) "regione_geografica_array"

array(0) { }

stringa:


string(12) "source_array"

array(0) { }

stringa:


string(13) "keyword_array"

array(0) { }

stringa:


3- Our area study
3- Our area study
The area study is defined to the North by the 150 mm/y isohyet (2018–2023) and to the South by the 850 mm/y isohyet (1981–1985), reprocessed based on the definition of level 8 of the WWF hydrography, extending the area of interest to include all the basins involved, for that scale of detail. The cut-out thus identified then becomes our study area.
string(18) "bibliografia_array"

array(0) { }

stringa:


string(15) "argomento_array"

array(0) { }

stringa:


string(10) "anno_array"

array(0) { }

stringa:


string(24) "regione_geografica_array"

array(0) { }

stringa:


string(12) "source_array"

array(0) { }

stringa:


string(13) "keyword_array"

array(0) { }

stringa:


4- The core of the Sahel, the liminal Sahel and the buffer zone
The map presents an internal subdivision of the Sahel, based on two isohyets: 150 mm/year during the driest five-year period in the North and 850 mm/year during the wettest five-year period in the South. In this way, we identify three distinct zones: the core of the Sahel (between the two isohyets just described) or the area that is always Sahel, both in drought phases and in wetter phases; the liminal Sahel, between 150 mm/year in drought conditions and 150 mm/year in wet conditions, which is active only during the wetter phases; and finally, the Sahelian buffer zone, between 850 mm/year in wet conditions and 850 mm/year in dry conditions, which is the area where the Sahel recedes during drought conditions and where it has different and more favourable pluviometric conditions.
string(18) "bibliografia_array"

array(0) { }

stringa:


string(15) "argomento_array"

array(0) { }

stringa:


string(10) "anno_array"

array(0) { }

stringa:


string(24) "regione_geografica_array"

array(0) { }

stringa:


string(12) "source_array"

array(0) { }

stringa:


string(13) "keyword_array"

array(0) { }

stringa:


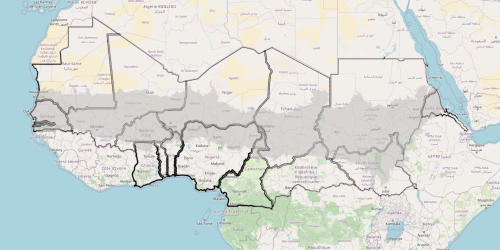
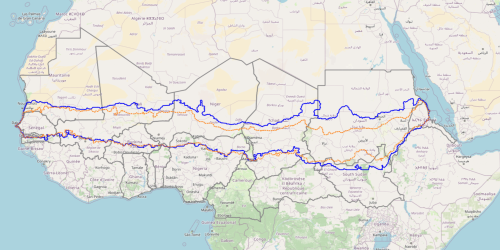
5- Sahel’s political, weighted borders
To assess the borders, we used two spatial distinctions: distance from the capital and proximity to two particularly exposed tripoints. We also identified four parameters to assign different weights to the borders of different countries. This made it possible to construct a representation that visually renders the complex situation of state borders in the Sahel, highlighting where they appear weakest or even irrelevant and where, on the contrary, they are most consolidated.
string(18) "bibliografia_array"

array(0) { }

stringa:


string(15) "argomento_array"

array(0) { }

stringa:


string(10) "anno_array"

array(0) { }

stringa:


string(24) "regione_geografica_array"

array(0) { }

stringa:


string(12) "source_array"

array(0) { }

stringa:


string(13) "keyword_array"

array(0) { }

stringa:


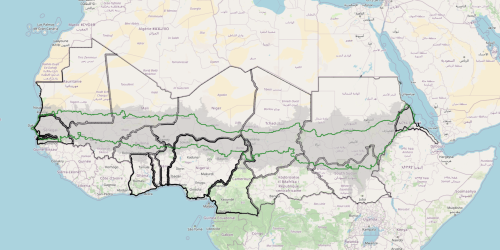
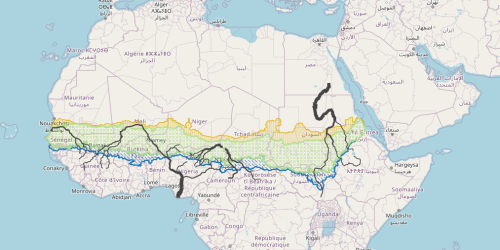
6- A first cartographic synthesis: Pluviometric and political Sahel
The map collects and intersects two different Sahels, highlighting both the mobility of the area in space and the existence of a Sahelian core and emphasising the changes in value of the state borders, depending on the political–economic evolution of the different countries.
string(18) "bibliografia_array"

array(0) { }

stringa:


string(15) "argomento_array"

array(0) { }

stringa:


string(10) "anno_array"

array(0) { }

stringa:


string(24) "regione_geografica_array"

array(0) { }

stringa:


string(12) "source_array"

array(0) { }

stringa:


string(13) "keyword_array"

array(0) { }

stringa:


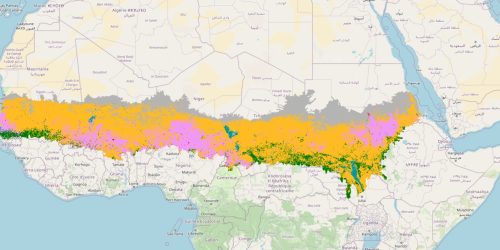
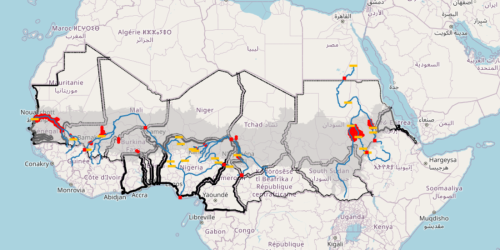
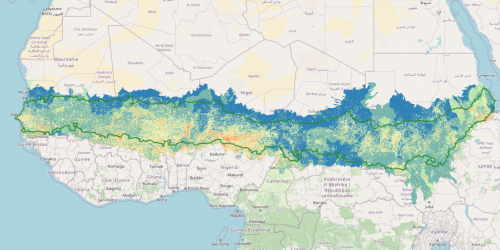
7- Land cover map of the Sahel
Land cover/use classes have been simplified into six main categories: (1) shrubs and herbaceous vegetation, (2) cultivated and managed vegetation, (3) forest, (4) urban/built-up areas, (5) herbaceous wetlands, and (6) bare or sparsely vegetated areas (including mosses and lichens). The classification is based on Copernicus Global Land Cover (GLC) data, harmonized to ensure consistency in the spatial analysis of land degradation indicators.
string(18) "bibliografia_array"

array(0) { }

stringa:


string(15) "argomento_array"

array(0) { }

stringa:


string(10) "anno_array"

array(0) { }

stringa:


string(24) "regione_geografica_array"

array(0) { }

stringa:


string(12) "source_array"

array(0) { }

stringa:


string(13) "keyword_array"

array(0) { }

stringa:


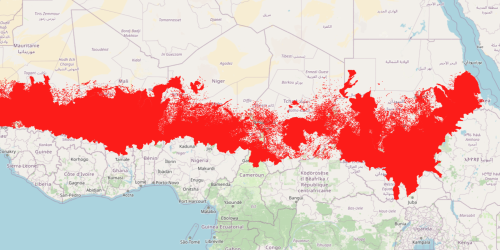
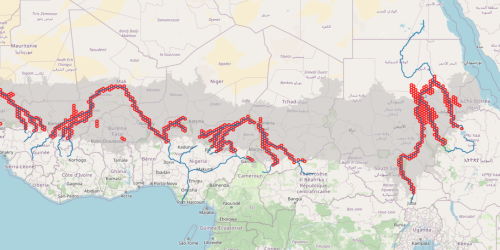
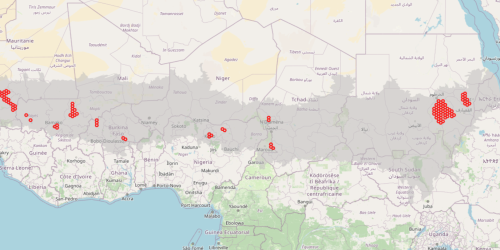
8- Convergence of Evidence map with nine land change issues

Convergence of Evidence (CoE) is an approach developed to analyze land degradation not through a single indicator, but by integrating multiple signals of environmental and human-induced stress. The core idea is that the co-occurrence of several critical factors—such as erosion, population pressure, productivity loss, and land use change—provides a more robust indication of ongoing or potential degradation.

The map shows that:

  • The areas with the highest convergence of degradation factors are located in the south, where human activities are more intense and agriculture is predominant.

  • The north appears more stable but is subject to chronic risks of desertification, despite lower anthropogenic pressure.

The approach enables precise mapping of degradation hotspots, offering a valuable tool for environmental restoration planning and monitoring of the Sustainable Development Goals (particularly SDG 15.3.1).

CoE allows us to address the complexity of land degradation in the Sahel in an integrated way, moving beyond reductionist views and supporting more informed and effective land management strategies.

string(18) "bibliografia_array"

array(0) { }

stringa:


string(15) "argomento_array"

array(0) { }

stringa:


string(10) "anno_array"

array(0) { }

stringa:


string(24) "regione_geografica_array"

array(0) { }

stringa:


string(12) "source_array"

array(0) { }

stringa:


string(13) "keyword_array"

array(0) { }

stringa:


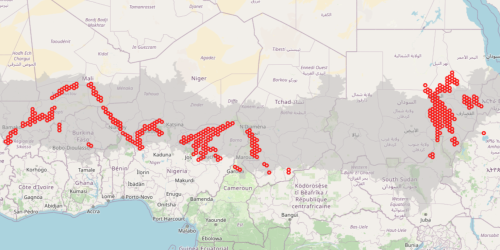
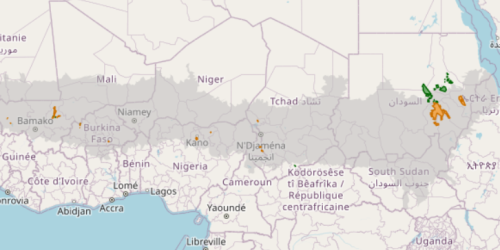
9- Spatial distribution of the indicators considered for the calculation of the Convergence of Evidence
Map of the individual indicators used for calculating the Convergence of Evidence (CoE). Each map represents an environmental or human-induced stress factor relevant to assessing land degradation in the Sahel region. The nine selected indicators are: population density, population change, drought risk, soil erosion (RUSLE), built-up areas, water stress, groundwater table decline, tree cover loss, and land productivity dynamics. The data come from global sources such as Copernicus, the World Resources Institute (WRI), the Global Human Settlement Layer (GHSL), and the Joint Research Centre (JRC). The spatial analysis of these indicators allows the identification of areas where multiple pressures converge, indicating a high risk of degradation.
string(18) "bibliografia_array"

array(0) { }

stringa:


string(15) "argomento_array"

array(0) { }

stringa:


string(10) "anno_array"

array(0) { }

stringa:


string(24) "regione_geografica_array"

array(0) { }

stringa:


string(12) "source_array"

array(0) { }

stringa:


string(13) "keyword_array"

array(0) { }

stringa:


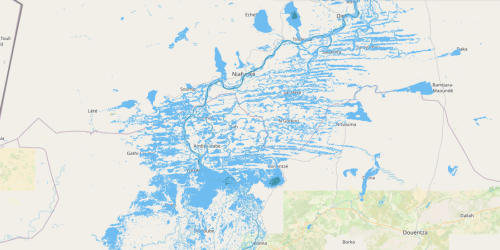
10- Details of the Inner Niger Delta (Mali) as part of the hydrological Sahel.
The map displays the maximum water extent (MWE) in areas flooded during the counter-seasonal period (1984–2021) and the presence of permanent waters. The Inner Niger Delta is one of the major wetlands of the Sahel, playing a crucial role in ecological resilience and sustaining livelihoods during the dry season.
string(18) "bibliografia_array"

array(0) { }

stringa:


string(15) "argomento_array"

array(0) { }

stringa:


string(10) "anno_array"

array(0) { }

stringa:


string(24) "regione_geografica_array"

array(0) { }

stringa:


string(12) "source_array"

array(0) { }

stringa:


string(13) "keyword_array"

array(0) { }

stringa:


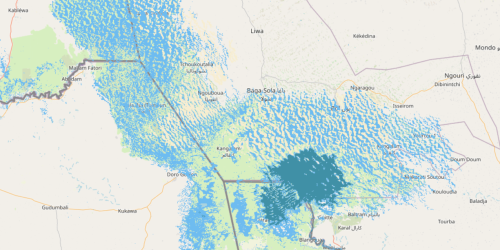
11- Details of Lake Chad as part of the hydrological Sahel
The map illustrates the maximum water extent (MWE) in areas flooded during the counter-seasonal period (1984–2021) and the presence of permanent waters. This representation highlights the importance of Lake Chad as a key area for water availability beyond the rainy season.
string(18) "bibliografia_array"

array(0) { }

stringa:


string(15) "argomento_array"

array(0) { }

stringa:


string(10) "anno_array"

array(0) { }

stringa:


string(24) "regione_geografica_array"

array(0) { }

stringa:


string(12) "source_array"

array(0) { }

stringa:


string(13) "keyword_array"

array(0) { }

stringa:


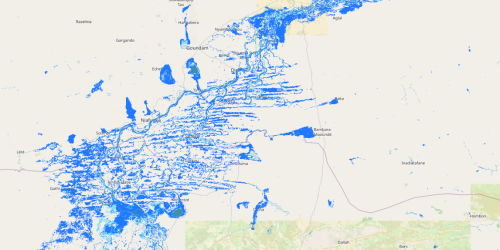
12- The hydrological Sahel— core area of the Inner Niger Delta (Mali).
The map shows the distinction between the hydrological core (light blue), i.e., areas flooded even during the driest years, the areas flooded only during the wettest biennium (dark blue), and the permanent waters (dark green). This classification highlights the Inner Niger Delta as a key water resilience area under variable climatic conditions.
string(18) "bibliografia_array"

array(0) { }

stringa:


string(15) "argomento_array"

array(0) { }

stringa:


string(10) "anno_array"

array(0) { }

stringa:


string(24) "regione_geografica_array"

array(0) { }

stringa:


string(12) "source_array"

array(0) { }

stringa:


string(13) "keyword_array"

array(0) { }

stringa:


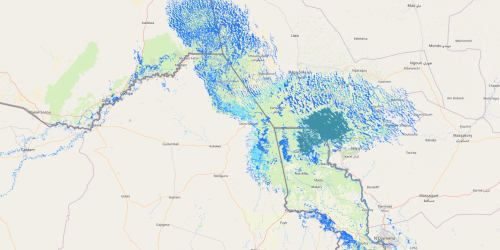
13- The hydrological Sahel— core area of Lake Chad (Chad).
The map illustrates the distinction between the hydrological core (azure), i.e., areas flooded even during the driest years, the areas flooded only during the wettest biennium (blue), and the permanent waters (dark green). This classification underscores Lake Chad’s role as a strategic water body subject to strong interannual variability.
string(18) "bibliografia_array"

array(0) { }

stringa:


string(15) "argomento_array"

array(0) { }

stringa:


string(10) "anno_array"

array(0) { }

stringa:


string(24) "regione_geografica_array"

array(0) { }

stringa:


string(12) "source_array"

array(0) { }

stringa:


string(13) "keyword_array"

array(0) { }

stringa:


14- The major reservoirs in the pluviometric Sahel
The map shows the distribution of the main reservoirs located within the pluviometric Sahel, based on a consolidated selection of data from Global Dam Watch (GDW) and Global Water Watch (GWW). A total of 523 reservoirs were identified, some of which are located outside the boundaries of the Sahel but are relevant for the control of regional hydrological dynamics. This representation highlights the critical role of storage infrastructure in regulating river regimes, managing floods, and ensuring water availability during the dry season.
string(18) "bibliografia_array"

array(0) { }

stringa:


string(15) "argomento_array"

array(0) { }

stringa:


string(10) "anno_array"

array(0) { }

stringa:


string(24) "regione_geografica_array"

array(0) { }

stringa:


string(12) "source_array"

array(0) { }

stringa:


string(13) "keyword_array"

array(0) { }

stringa:


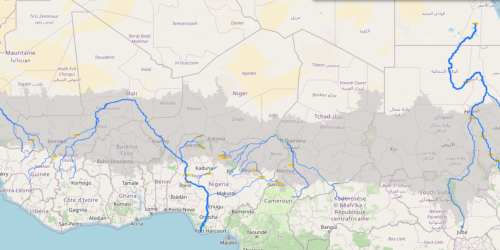
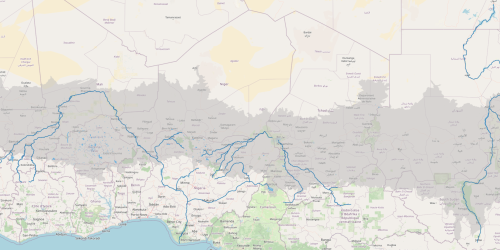
15- Main dams and river flow
The map provides insights into how the flow of watercourses evolves as they receive additional water input from tributaries along their course. At each junction of a tributary to one of the major rivers, and taking into account roughly the size of the contribution, the blue line outlines the river’s flow becomes proportionally thicker. The map indicates major dams that regulate and manage the flow.
string(18) "bibliografia_array"

array(0) { }

stringa:


string(15) "argomento_array"

array(0) { }

stringa:


string(10) "anno_array"

array(0) { }

stringa:


string(24) "regione_geografica_array"

array(0) { }

stringa:


string(12) "source_array"

array(0) { }

stringa:


string(13) "keyword_array"

array(0) { }

stringa:


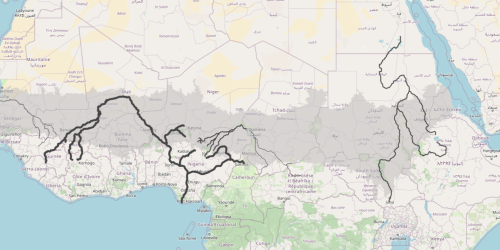
16- Human footprint on Sahelian rivers
The map is an attempt to represent how anthropogenic pressure increases as the rivers progress downstream. We first segmented each river into stretches between the main "breaks" that characterise them: the confluence of the main tributaries, on one hand, and the major dams, on the other hand. For each river segment, a buffer zone of 10 km from each bank was calculated to define the area more directly affected by the proximity of the river. The resident population in each of these buffer zones was then determined using data from the JRC Global Human Settlement Layer. The width of the black line broadly indicates the size of the population that gravitates to those waters. Then, the population data for each river segment were aggregated by adding the subsequent segments following the river's course. With this aggregation, we aim to illustrate how the population that is dependent on the river increases along its length.
string(18) "bibliografia_array"

array(0) { }

stringa:


string(15) "argomento_array"

array(0) { }

stringa:


string(10) "anno_array"

array(0) { }

stringa:


string(24) "regione_geografica_array"

array(0) { }

stringa:


string(12) "source_array"

array(0) { }

stringa:


string(13) "keyword_array"

array(0) { }

stringa:


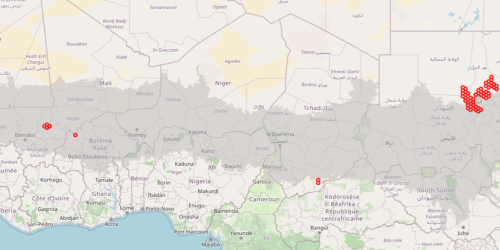
17- Identification of area of interest for pivot irrigation systems (AOIp)
Map illustrating the hexagonal cells that define the Area of Interest (AOI) for pivot irrigation systems (AOIp) in the Sahel region. Each hexagon represents a zone identified through satellite imagery as hosting circular irrigated fields, such as those driven by central pivot systems.
string(18) "bibliografia_array"

array(0) { }

stringa:


string(15) "argomento_array"

array(0) { }

stringa:


string(10) "anno_array"

array(0) { }

stringa:


string(24) "regione_geografica_array"

array(0) { }

stringa:


string(12) "source_array"

array(0) { }

stringa:


string(13) "keyword_array"

array(0) { }

stringa:


18- Main areas of potential interest (gravity-fed irrigation)
The map shows, using hexagonal cells, the areas of the Sahel that offer conditions likely to be suitable for gravity-fed irrigation systems, particularly along the major Sahelian rivers.
string(18) "bibliografia_array"

array(0) { }

stringa:


string(15) "argomento_array"

array(0) { }

stringa:


string(10) "anno_array"

array(0) { }

stringa:


string(24) "regione_geografica_array"

array(0) { }

stringa:


string(12) "source_array"

array(0) { }

stringa:


string(13) "keyword_array"

array(0) { }

stringa:


19- Selected area of interest (AOI)
Refined AOI that excludes hexagonal cells dominated by wetlands. This adjustment was necessary to focus solely on irrigation-related vegetation, filtering out seasonal floodplains that could distort NDVI results.
string(18) "bibliografia_array"

array(0) { }

stringa:


string(15) "argomento_array"

array(0) { }

stringa:


string(10) "anno_array"

array(0) { }

stringa:


string(24) "regione_geografica_array"

array(0) { }

stringa:


string(12) "source_array"

array(0) { }

stringa:


string(13) "keyword_array"

array(0) { }

stringa:


20- Identification of area of interest for surface irrigation (AOIsu)
Final area of interest (AOIsu) for surface irrigation systems, focusing on a limited number of well-documented and verified schemes, including those in Senegal, Mali, Burkina Faso, Nigeria, Chad, Cameroon, and Sudan.
string(18) "bibliografia_array"

array(0) { }

stringa:


string(15) "argomento_array"

array(0) { }

stringa:


string(10) "anno_array"

array(0) { }

stringa:


string(24) "regione_geografica_array"

array(0) { }

stringa:


string(12) "source_array"

array(0) { }

stringa:


string(13) "keyword_array"

array(0) { }

stringa:


21- AOIp and AOIsu after contour cut
Cartographic overlay showing the final delineation of AOIp (pivot) and AOIsu (surface) irrigation systems, after manually removing wetland regions and applying specific clipping for complex zones.
string(18) "bibliografia_array"

array(0) { }

stringa:


string(15) "argomento_array"

array(0) { }

stringa:


string(10) "anno_array"

array(0) { }

stringa:


string(24) "regione_geografica_array"

array(0) { }

stringa:


string(12) "source_array"

array(0) { }

stringa:


string(13) "keyword_array"

array(0) { }

stringa:


22- Main river basins in the Sahel
The Senegal River basin is shown in beige, the Niger River basin in yellow, the Volta River basin in brown, the Lake Chad basin in purple, and the Nile River basin in pink. For the Niger, Volta, and Nile river basins, only the part that falls within the Sahel is shown.
string(18) "bibliografia_array"

array(0) { }

stringa:


string(15) "argomento_array"

array(0) { }

stringa:


string(10) "anno_array"

array(0) { }

stringa:


string(24) "regione_geografica_array"

array(0) { }

stringa:


string(12) "source_array"

array(0) { }

stringa:


string(13) "keyword_array"

array(0) { }

stringa:


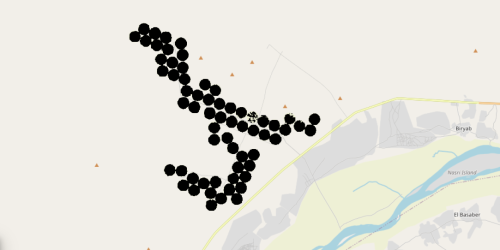
23- Evolution of Waha project from 2009 to 2024 (period: March–May)
Temporal sequence of the Waha pivot irrigation system in Sudan, from its limited extension in 2009 to its maximum expansion in 2018 and total collapse in 2024. The maps display the progressive growth and abrupt disappearance of the circular irrigated plots.
string(18) "bibliografia_array"

array(0) { }

stringa:


string(15) "argomento_array"

array(0) { }

stringa:


string(10) "anno_array"

array(0) { }

stringa:


string(24) "regione_geografica_array"

array(0) { }

stringa:


string(12) "source_array"

array(0) { }

stringa:


string(13) "keyword_array"

array(0) { }

stringa:


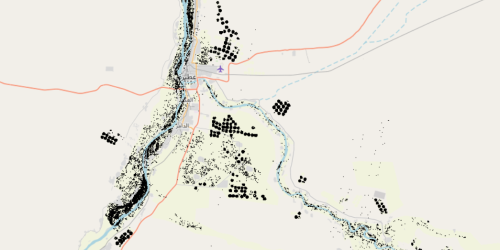
24- Evolution of GLB project from 2009 to 2024 (period: March–May)
string(18) "bibliografia_array"

array(0) { }

stringa:


string(15) "argomento_array"

array(0) { }

stringa:


string(10) "anno_array"

array(0) { }

stringa:


string(24) "regione_geografica_array"

array(0) { }

stringa:


string(12) "source_array"

array(0) { }

stringa:


string(13) "keyword_array"

array(0) { }

stringa:


25- Evolution of irrigation over time in the Atbara area
string(18) "bibliografia_array"

array(0) { }

stringa:


string(15) "argomento_array"

array(0) { }

stringa:


string(10) "anno_array"

array(0) { }

stringa:


string(24) "regione_geografica_array"

array(0) { }

stringa:


string(12) "source_array"

array(0) { }

stringa:


string(13) "keyword_array"

array(0) { }

stringa:


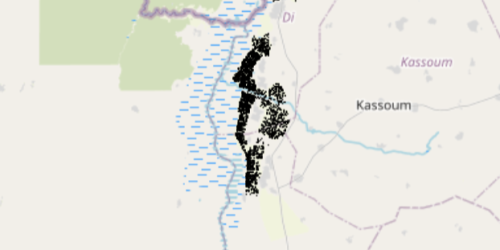
26- Mapping of Sourou Valley (period: April–May)
string(18) "bibliografia_array"

array(0) { }

stringa:


string(15) "argomento_array"

array(0) { }

stringa:


string(10) "anno_array"

array(0) { }

stringa:


string(24) "regione_geografica_array"

array(0) { }

stringa:


string(12) "source_array"

array(0) { }

stringa:


string(13) "keyword_array"

array(0) { }

stringa:


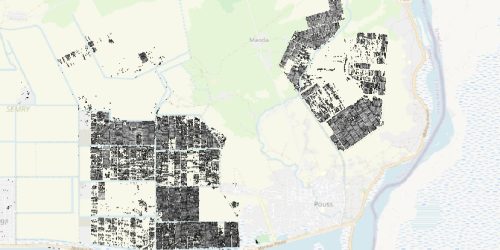
27- Mapping of the SEMRY 1 and 2 projects (period: February–April)
string(18) "bibliografia_array"

array(0) { }

stringa:


string(15) "argomento_array"

array(0) { }

stringa:


string(10) "anno_array"

array(0) { }

stringa:


string(24) "regione_geografica_array"

array(0) { }

stringa:


string(12) "source_array"

array(0) { }

stringa:


string(13) "keyword_array"

array(0) { }

stringa:


28- A cartographic synthesis: the breath of the Sahel
The map brings together some of the elements that contribute to the fluidity of the Sahel and the “flow” within it. The liminal Sahel, the core and the buffer zone indicate the continuous oscillation of the “Sahelian shore” between desert and humid climates. It is the breath of the Sahel, its expansion and contraction, depending on the alternation of rainy and dry periods. Among the representations of rivers, we have chosen the one relating to the human footprint to take into account (albeit only with an image) on the one hand the course of the main rivers and their role in connecting the different parts of the Sahel, and on the other hand the presence of human communities, which in some way also symbolises their flow and the “weight” they exert on water resources. Rivers carry with them another aspect of the Sahel's breath, that of the variability of floods and therefore of the change in the extent of seasonally flooded areas.
string(18) "bibliografia_array"

array(0) { }

stringa:


string(15) "argomento_array"

array(0) { }

stringa:


string(10) "anno_array"

array(0) { }

stringa:


string(24) "regione_geografica_array"

array(0) { }

stringa:


string(12) "source_array"

array(0) { }

stringa:


string(13) "keyword_array"

array(0) { }

stringa:


29- Another cartographic synthesis: the cages
This map includes many of the aspects that stifle the Sahel, forcing it to breathe with difficulty, imprisoned in rigid cages. Among these, first and foremost are state borders, which divide the Sahel into territorial traps (Agnew, 1994, 2015). Other traps capture water, such as dams on major rivers and large irrigation systems. To make the latter more visible at the regional scale, we have used hexagons to indicate areas of interest (AOIs) for both pivot and surface irrigation systems.