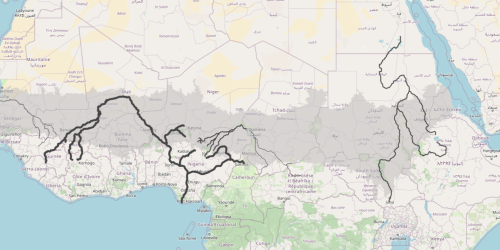
16- Human footprint on Sahelian rivers
The map is an attempt to represent how anthropogenic pressure increases as the rivers progress downstream. We first segmented each river into stretches between the main "breaks" that characterise them: the confluence of the main tributaries, on one hand, and the major dams, on the other hand. For each river segment, a buffer zone of 10 km from each bank was calculated to define the area more directly affected by the proximity of the river. The resident population in each of these buffer zones was then determined using data from the JRC Global Human Settlement Layer. The width of the black line broadly indicates the size of the population that gravitates to those waters. Then, the population data for each river segment were aggregated by adding the subsequent segments following the river's course. With this aggregation, we aim to illustrate how the population that is dependent on the river increases along its length.